

Graphs in R – Data Visualization with R Programming Language
R-Tutorials shows how to create convincing graphs in R Do you want to create overwhelming plots? Do you want to show your data crystal clear? Do you want your data to be understood by everyone? Do you want a versatile graphics toolbox? Do you want powerful formatting skills? If you anwered YES to some of
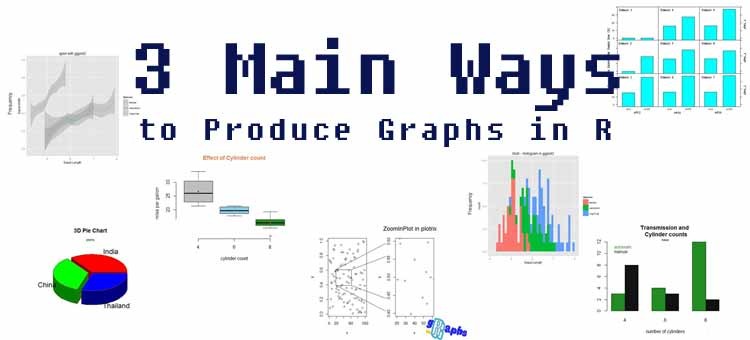
The three main ways to produce graphs in R – Data Visualization in R
Data Visualization in R If you are performing statistical analysis, data visualization is an inherent part of it. There is no quality data analysis software without visualization tools. We all know Microsoft Excel and we also know those pie and bar charts we can create quite easily with Excel. If somebody without any analysis background