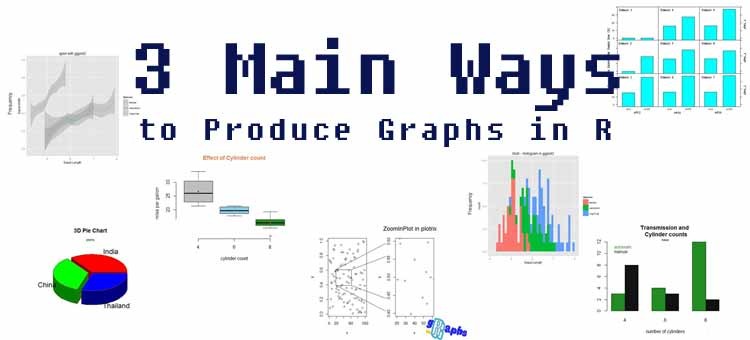
teaching principles

Our Teaching Principles

We dedicate our time to deliver high quality R training materials. To assure our standards are met our work is guided by the following principles: Efficiency – in our tutorials we focus on the elements of R which are crucial for every day programming. Once you learned a solid understanding of R through our materials, you can branch 

Continue Reading…

text mining

Text Mining, Web Scraping and Sentiment Analysis with R – Mining Twitter Data

Is the Text Mining, Web Scraping and Sentiment Analysis with R course for you? Are you an advanced R user, looking to expand your R toolbox? Are you interested in social media sentiment analysis? Do you want to learn how you can get and use Twitter data for your R analysis? Do you want to learn 

Continue Reading…

social media analysis

Social Media Analysis in R

Lately I am receiving more and more requests about R and social media analysis. Therefore, I am creating a whole video tutorial on this topic. If you use R’s social media mining tools in a proper way, you can do some very powerful things when it comes to marketing or even investing. This application of 

Continue Reading…

statistics in r

Statistics in R – R for Statistical Analysis

Is the Statistics in R course for you? Are you a R user? Do you want to learn more about statistical programming? Are you in a quantitative field? You want to know how to perform statistical tests and regressions? Do you want to hack the learning curve and stay ahead of your competition? If YES 

Continue Reading…

What is Udemy? – How does R Tutorials Provide its Products?

Why is it good to learn via Udemy? Udemy is an online tutoring platform where tutors upload videos and learning materials. R Tutorials cooperates with Udemy and offers its R and Excel tutorials via this platform. R Tutorials offers several full teaching tutorials at Udemy. Among those videos you may also find the 2+hr free ‘R Basics’ course including exercises 

Continue Reading…

graphs in r

The three main ways to produce graphs in R – Data Visualization in R

Data Visualization in R If you are performing statistical analysis, data visualization is an inherent part of it. There is no quality data analysis software without visualization tools. We all know Microsoft Excel and we also know those pie and bar charts we can create quite easily with Excel. If somebody without any analysis background 

Continue Reading…

Quality R Training for You